Designing a Pitch Deck in Figma

At hotels.ng, one of the many ways we use the Figma Design tool is using it to design corporate documents. Our reason being, official documents does not have to look staid or boring for it to appear official or important. And so we make sure, we design and make presentations using beautiful slides.
There are several reasons why this method works for us, one being it makes documentation processes, reports compiling pitch decks and presentations fun and beautiful. It also makes these documents interesting for those on the receiving end to read and go through. Not excluding the fact that it allows for multiplayer on the same design board in real-time.
This means the content team can be working on the contents while the design team will be designing the frames or slides. It has wonderful features like this which makes us use the Figma for several other purposes beyond UI design.
The free Pitch Deck Resource
Editing this Pitch Deck
The Pitch Deck above was designed in Figma and it’s pretty easy to make use of. To get started kindly click HERE to open the Figma. Once you have opened the Figma file in your browser, duplicate it to your drafts. Duplicating the file to your draft allows owning the file, therefore, granting you editing access to the file.
Then you launch the file and with the full access, you can now customize the design however you see fit. You can change the font and replace it with any font of your choice. You can replace whatever element you see fit by importing any element you wish to use. Or add a new slide which in this case we are using frames by simply duplicating a frame and editing it however you deem fit.
Customizing the Charts
Editing the graphs might be a bit tricky for someone with little UI Design background, but once you have your data values then you should be good to go. For the bar charts, you will either use the rectangle tool or the pen tool to draw the bars. Before that, you will design the layout and scale of your chart depending on your scale.
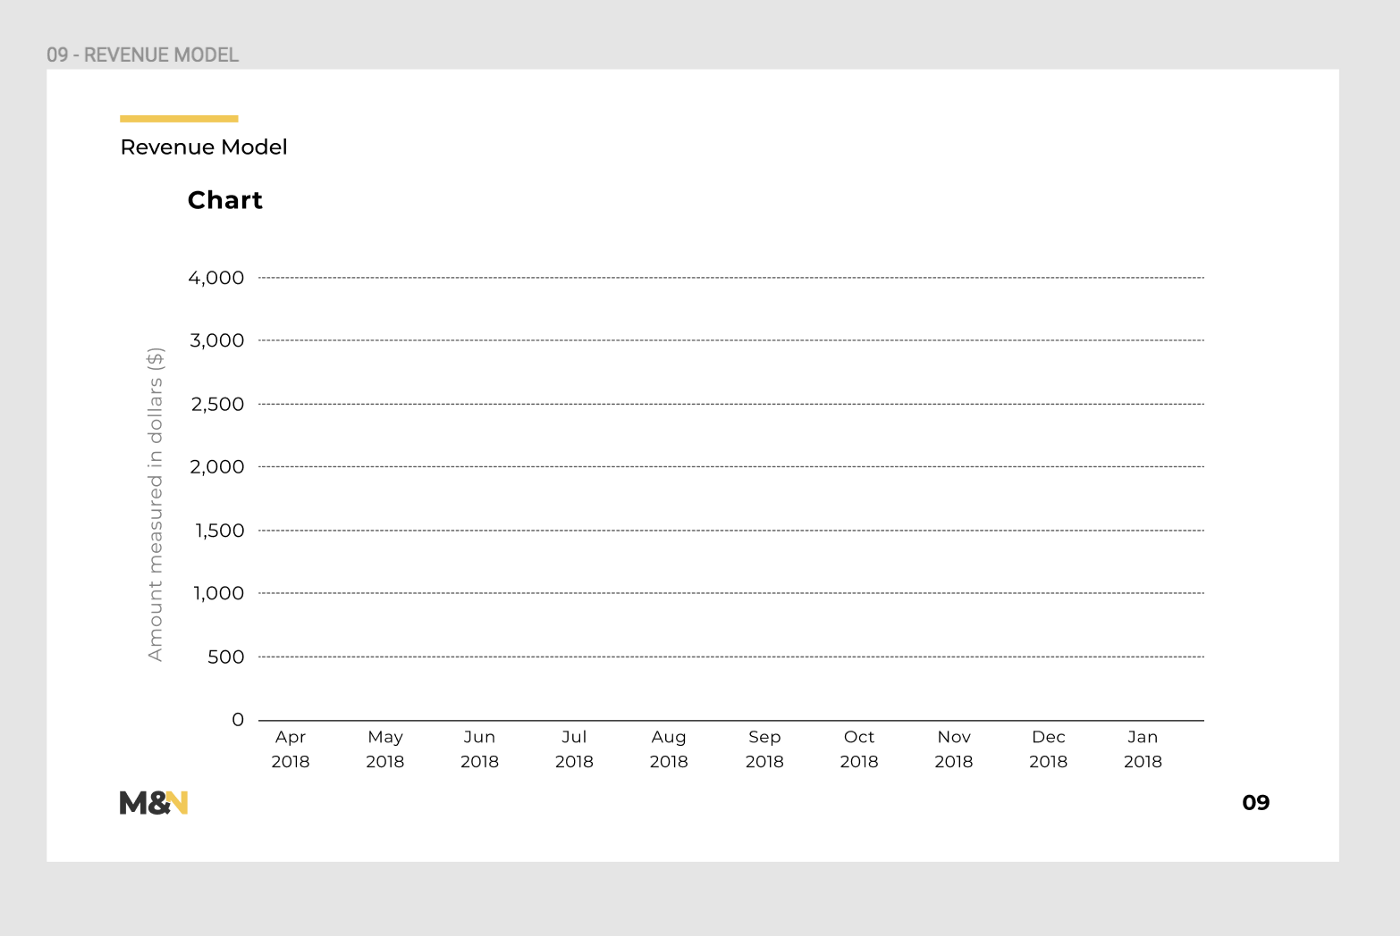
Achieving the dotted lines can be done by using the line tool to draw the lines and then selecting all of them and clicking on the stroke options. Then you input the value to get the dotted lines. Steps highlighted below.
Designing the line chart is a little different. Here you will be using the pen and eclipse tool to draw the line and stop points. You will also make use of the alignment tools to make sure our points are aligned properly.

First, you place the tiny circles (which you drew using the ellipse tool) on the scale to correspond with the horizontal axis (or x-axis) and the vertical axis (or y-axis). Then you use the alignment tools on the right panel to make sure they are properly aligned and use the stroke properties to give the line an appropriate stroke same with the circle. After doing that, you will now use the pen tool to draw your line chart using the circles as connecting points for the line.
The Presentation
After you are done designing your slides, you can easily make your presentation in Figma by clicking on the presentation button and you are good to go. It also opens in full screen. So there you go, the one design tool that allows you to make designs and presentations from the same platform.
Namnso Ukpanah — is a Product Designer with Flutterwave and also the Designer Advocate for Figma Africa, you can join the Slack group here, where they’re currently helping grow the design ecosystem in Africa through design education and connecting companies to designers and vice versa.


